When I woke up just after dawn on September 28, 1928,
I certainly didn't plan to revolutionize all medicine
by discovering the World's first antibiotic.
Sir Alexander Fleming
(1881-1955; Nobel 1945)
It is with medicine as with mathematics:
We should occupy our minds only with what we continue to know;
what we once knew is of little consequence.
Charles Augustin
Sainte-Beuve (1804-1869)
(2010-08-02) What is the normal human body temperature?
The usual answer is a simple rule of thumb: 37°C or 98.6°F
(same thing).
This traditional estimate of normal body temperature is originally based on
the findings of
Dr. Carl
Wunderlich (1815-1877)
who recorded about a million armpit temperature measurements on 25 000 patients.
When Gabriel Farhenheit devised his temperature scale in 1714,
he meant
100°F to be the normal temperature of the human body.
However, this turns out to be only a rough estimate which is not
appropriate for clinical thermometry (either the measurement
wasn't accurate or Fahrenheit was running a slight fever at the time).
Modern studies
(1992)
have found the average normal temperature for adults to be close to 98.2°F
(36.8°C).
Older people usually have lower mean body temperatures,
which are normally well below 98.6°F.
The traditional threshold for fever is 38°C (100.4°F).
However, body temperature does depend on the time of day.
For women, it also varies with the phase of the menstrual cycle, which may translate
into a higher baseline body temperature.
It's thus more accurate to base a diagnosis on a curve of the average body
temperature recorded at different times of the day when the person was known to be in good health.
Note that the normal body temperatures
of various warm-blooded animals depends strongly on their species
(it's about 42°C for a healthy chicken).
(2010-08-02) What is the normal human arterial blood pressure?
During a normal heartbeat, the blood pressure varies between
a minimum (diastolic) and a maximum (systolic).
Both numbers are usually expressed in mmHg (millimeters of mercury)
or torrs (those two units are used interchangeably;
the minute difference
between them makes no clinical difference whatsoever).
In some countries (France, etc.) medical instruments are usually
graduated in centimeters of mercury instead (cmHg).
A typical blood pressure might thus be given as 130/80 in the US and
13/8 in France.
Blood pressure should be measured at the level of the heart itself.
This is one reason why it's usually measured on the upper arm
(the hydrostatic pressure difference between the heart and the lower leg
of a standing person is about 80 mmHg).
Readings can be influenced by many begnign factors,
including posture and recent physical activity.
The normal blood pressure of a healthy person will typically be
between 90/60 and 120/80.
(2010-08-02) What is the normal pulse rate in humans at rest?
At rest,
a healthy human heart beats at a rate of about 60 pulsations per minute (1 Hz).
The pulse rate of trained athletes can be much lower and the heartbeat of
sedentary people is often faster...
During and after a substantial effort, the pulse of a person quickens.
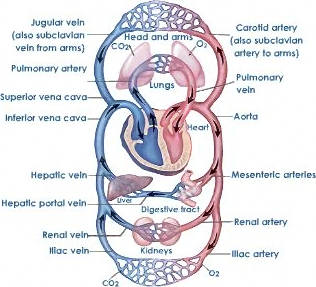
(2012-08-24)
Circulation of the blood
It was first described in 1628, by
William Harvey (1578-1657).
For more than a thousand years, the teachings of Galen
(AD 129-217)
were not questioned by medical students or their teachers.
In particular, it was thought and taught that veinous blood was produced
by the liver and consumed by the rest of the body.
The first success story of modern experimental medecine was to prove that it ain't so.
In 1628, Harvey (1578-1657)
estimated extremely
conservatively that the heart pumps no less than 540 pounds of blood per day
(modern estimates are nearly 30 times larger;
around 7 tons per day).
Clearly, the liver could not possibly produce that much blood...
Blood has to circulate!
The heart of mammals is a double pump
(a full circuit of the blood goes through the heart twice).
The right half of the heart pulls the blood from the veinous network through the
two large venae cavae and pushes it into
the pulmonary artery.
The left part of the heart
pulls blood back from the pulmonary vein and pushes it into the
arterial network (aorta, carotid, etc.)
In either half of the heart, blood enters into the atrium
(part of which is the auricle )
and it's expelled from the ventricle.
(2012-08-25) Respiration is
a slow form of combustion (1780)
The joint work of
Lavoisier (1743-1794) and Laplace (1749-1827).
It is the role of the lungs to continuously convert veinous blood
into arterial
blood (with oxygen-rich hemoglobin).
All other human tissues take oxygen from blood and reject carbon dioxide
in it. As the reverse process takes place in the lungs,
respiration appears chemically to be a form of slow
combustion, as was first established
by Laplace
and Lavoisier in 1780.
(2010-08-02) What dietary caloric intake is considered normal ?
The caloric intake should compensate for the expenditure of energy
spent on basic metabolic functions and physical efforts.
If the intake is more than that, then it is stored the form of body fat.
That fat is burned as needed when more energy is required than what is
provided by the daily intake.
A very rough rule of thumb is that a person burns about 100 W of power
(power is the energy spent per unit of time).
One watt (W) is a joule (J) per second.
A calorie (cal) per second
is 4.184 W.
The unit of energy used by dieticians is the so-called
dietary calorie, large calorie or kilocalorie
whose proper symbol is kcal
(the confusing capitalized symbol "Cal"
was once popular but it's now deprecated).
1 kcal = 1000 cal = 4184 J
If you burn 100 W continuously for a full day
(24 h is 86400 s) you will have burned
8 640 000 J or about 2065 kcal.
Typically a reasonably active average man will consume energy at the above
rate (2000 kcal/day) and should compensate for it
by an equal food intake. The need of other individuals may vary.
For example, a young woman may only need 1200 kcal/day or less.
Dr. Rita Rae Fontenot
(2006-10-19) Emergency use of an IU rating.
How do I give 125 IU from poorly-labeled 10 mL vials of 10000 units?
This amounts to 1000 IU per mL. 8 doses per mL.
To administer such a small dose (2 drops) with some precision,
you may want to dilute it first.
For example 1 vial in 90 cc
of an inactive solution yields 100 cc,
from which you get 80 doses of 125 IU (1.25 cc each).
If you're a young doctor by herself in a remote area,
I'll just pray that you'll know what to do with whatever means
you have at your disposal
and whatever help you can gather about this emergency.
The IU (International Unit) is a unit of biological activity
which is standardized for each substance
(fairly arbitrarily) by the World Health Organization.
It's also abreviated UI (from the French locution
unité internationale ).
For a simple chemical (e.g., Vitamin C) the WHO simply assigns a value of
1 IU to a particular mass of that substance.
The rating of biological preparations (e.g., vaccines)
is more delicate but it need not be of concern to the practitioner...
If you need to give 125 IU of a substance to a patient,
you must first know the concentration of the solution you have at hand.
Normally, this is shown directly in IU/ml, IU/mL or IU/cc (same thing) on the package.
It could also be given as the reciprocal of that:
For example 1mL/40 IU is the same as 40 IU/mL.
(2007-03-29) Concentration is amount (grams or moles) per volume.
Blood glucose concentration (bG) is thus given in mg/dL or in mmol/L.
A mole of
glucose
(CAS 50-99-7)
weighs 180.16 grams.
Therefore, a blood glucose concentration
(bG) of 1 mmol/L
is equivalent to 18.016 mg/dL.
The blood glucose concentration given in mg/dL
(the form most commonly used by doctors and
diabetic patients across Europe and the US)
is thus about 18 times the number in mmol/L
(often used in medical research).
Blood
Glucose, Plasma Levels (bG)
mg/dL
mmol/L
Interpretation and/or Symptoms
540
30.0
Severe imbalance.
360
20.0
Very high blood sugar level.
270
15.0
High or very high blood sugar (depending on patient)
200
11.1
180
10.0
Non-diabetic postprandial (i.e., after meal)
144
8.0
108
6.0
Non-diabetic preprandial (i.e., before meal)
100
5.55
90
5.0
72
4.0
Slightly low. Mild lethargy.
54
3.0
Low blood sugar level. Lethargy.
36
2.0
Extremely low. Risk of fainting.
Whole blood concentration is actually 15% lower than the
plasma level quoted above,
but modern portable glucose meters are calibrated to match
the plasma readings obtained in lab tests.
Venous blood and capillary blood may have slighlty different
compositions only when blood chemistry evolves rapidly (after
a meal).
(2007-03-29) Blood Glucose and HbA1c Glycated hemoglobin buildup indicates average blood glucose (bG).
The table below gives the rough correspondence between HbA1c results (in %)
and long-term average blood glucose level (bG in mg/dL).
It is based on the following approximative formula:
(mean bG, in mg/dL) = 35.6 (% of A1c hemoglobin)
- 77.3
(2021-07-10) Body Mass Index (BMI in kg/m2 )
BMI = (Weight in kilograms) / (Height in meters)2 BMI = 703.07 × (Weight in pounds) / (Height in inches)2
As a rule of thumb for adults, a normal BMI is between 18.5 and 25. Obesity (class I) starts at 30.
Extreme obesity (class II) starts at 35 and severe obesity (class III) at 40.
Conversely, the healthy weight of a person of height h is between 18.5 h2
and 25 h2.
The idea was developed between 1830 and 1850 by the Belgian statistician
Adolphe Quételet (1796-1874)
Standard classification by weight, according to BMI (in kg/m2 )
17 kg/m2
18.5 kg/m2
25 kg/m2
30 kg/m2
35 kg/m2
Underweight
Normal
Overweight
Obese
The BMI doesn't scale correctly, since people of the same shape have a weight proportional to
the cube of their height. The BMI is thus a very poor basis for classifying very short
or very tall people. The so-called
ponderal index
(in kg/m3 ) has been advocated instead.
(2016-03-20) Mosquito-borne diseases.
They're eradicated below a certain ratio of local mosquitoes per human.
Such diseases are transmitted by specific species of mosquitoes.
Dengue
(in French: la dengue, le petit palu, la fièvre rouge).
At least five different types of viral infections. Each infection normally lasts
only 2 to 7 days and subsequently provides lifelong immunity to one serotype only
(with short-term immunity to other types).
The risk of life-threatening complications
is increased by multiple infections.
Yellow fever
(in French: fièvre jaune, vomi noir).
First human virus ever isolated (1927).
Spread by female Aedes aegypti.
Chikungunya.
In 2005 and 2006, an epidemic of chikungunya infected nearly one third
of the population in French Reunion Island.
Malaria.
(French: paludisme)
The key example discussed below.
Malaria was known in Europe since antiquity.
The parasite responsible for the disease was first identified in the blood of
infected patient by the French military physician
Alphonse Laveran in 1880.
Malaria is still causing hundreds of thousands of deaths every year,
mostly in Africa.
In 1897 the fact that malaria was actually transmitted by mosquito bites
was discovered in India by the British military physician
Ronald Ross (1857-1932;
Nobel 1902).
In 1911, it was Ross himself who first stated a surprising mathematical fact,
which he called the mosquito theorem :
Malaria is locally eradicated as soon as the number of mosquito per inhabitant
falls below a certain predictable threshold.
(Thus, it's not necessary to get rid of every single mosquito.)
Considering a constant local population of N humans and n
mosquitoes, Ross assumed that every mosquito
(infected or not) would inflict an average number of f dt
bites over a small interval of time dt.
Both the biting mosquito and the biten human become infected if either
one of them was infected before the bite.
The number of infected humans and mosquitoes are respectively approximated
by two continuous functions of time, I(t) and i(t).
The Ross Model :
In the time-scale of interest, Ross neglected the natural demographic occurences
of human births and deaths. The healing rate among humans is a constant
g. The number I(t) of infected humans thus obeys
the following differential relation (the first term
accounts for infected mosquitoes biting a healthy human and the second
term pertains to newly-healed humans):
dI(t)/dt = i(t) [ 1 - I(t)/N ] f
- I(t) g
On the other hand, infected mosquitoes never heal.
However, they're always born uninfected and their mortality rate m
ends up playing the same mathematical rôle as the healing of
humans (under the assumption that the mosquito population is constant,
their mortality-rate equals the birth-rate).
di(t)/dt = I(t) [ 1 - i(t)/n ] f
- i(t) m
Stationary Rates of Infection (Ronald Ross, 1911) :
Ross remarked that the infected populations were stationary when
both of the above variations vanished, namely when:
i [ 1 - I/N ] f = I g
I [ 1 - i/n ] f = i m
Dividing those two equations into i I, we obtain two linear relations between 1/I and 1/i:
i ( N + m ) =
I ( n + g )
Thus, the first equation multiplied into ( N + m ) becomes:
I ( n + g ) [ N - I ] f = I g ( N + m )
This equation in I has a trivial solution (I = 0) and a nontrivial one:
(2016-03-11) Propagation of epidemics.
Predictions based on the simplest mathematical model (SIR).
The first simplified theoretical model which explained general epidemics was proposed in 1927 by
William Kermack (1898-1970) and Anderson McKendrick (1876-1943).
That model considers just three compartments of the total population (dead or alive)
whose importance vary with time (t).
It's assumed that an individual becomes fully contagious upon infection, a condition which ends abruptly with
total recovery or death (because corpses are normally isolated).
S(t) : The number of individuals susceptible of getting the disease.
I(t) : The number of infectious people (infected and contagious).
R(t) : The remainder (people who have either recovered or died).
As the dynamics of a typical epidemic is much faster than the normal demographics of birth and death,
it can be assumed that the sum of the three compartments is constant.
In a new viral disease;
S(t) decreases at a rate dS/dt proportional to the
number of contacts between the unexposed population S and
the contagious population I.
The number R(t) of recovered or dead individuals
simply decays at a constant rate c
(combining proper recovery and mortality rate).
Changing the variable from t to u with du = I dt, we have:
dS = -b S du
and
dI = (b S - c) du =
-dS - c du
This yields S = S(0) exp(-b u) which we plug into the second relation:
dI = [ b S(0) exp(-b u) - c ] du
Before we integrate that,
we must point out that only positive values of the quantity I are acceptable
(which does make u an increasing function of t).
So the epidemic dies out immediately (when I(0) is tiny) if dI
is negative at (u=t=0) which happens when b S(0) ≤ c.
Otherwise:
I(u) = I(0) + S(0) [ 1 - exp(-b u) ]
- c u
S(u) = S(0) exp(-b u)
The maximum of I (dI = 0) occurs when b S(0) exp(-b u) = c. Namely:
Imax = I(0) + S(0) - c/b
- c umax
umax = Log ( b S(0) / c ) / b
Introducing the parameter R0 = b S(0) / c, this boils down to:
Imax = I(0) + S(0)
R0 - 1 - Log R0 R0
As the number of infected people who require professional medical attention can be
assumed to be a fixed proportion k of the number I(u) of infected people,
k Imax is the minimum capacity the healthcare system should have in order
not to be overwhelmed (in which case people who could have survived will die).
If that capacity is inadequate, the only acceptable solution is to take forceful
confinment measures to lower R0 to reduce Imax
(which epidemiologist call flattening the curve).
This also delays the peak and may buy some precious time to increase capacity
(summoning reserve personnel, training volunteers, installing new beds, manufacturing ventilators, etc.)
I have to confess that I am slightly annoyed by the many younger YouTube mathematicians who have
spoken out in the wake of the COVID-19 pandemic.
They assert, without having even tried, that the above is "difficult to solve"
because the equations are nonlinear. This ain't so; not all nonlinear equations are difficult.
The basic model and its solution do provide a useful baseline which is easy to understand
without computer simulations and obscure comments thereof.
What's difficult is to devise more realistic models (for which numerical methods are fully justified)
and devise effective countermeasures in a complex world.
Simplified assumptions are just a first step.
Like any mathematical model, this is an oversimplification of reality.
So is Galileo's law of falling bodies
obtained by neglectingair resistance.
In both cases, it's still a good thing to master the basic mathematics
involved in order to understand how and why reality deviates from the idealized models.
(2020-03-27) Recovering from a Pandemic
To save lives, everyone should try to get infected as late as possible.
This is being written in the middle of the COVID 19 pandemic,
shortly after the twentieth Birthday of this site
(created on 2000-03-19, precisely to promote a proper mathematical
understanding of the world around us).
Such a basic understanding is invaluable not only to policymakers and their advisers
but also to the general public, who might otherwise reject unpopular measures like confinment:
The main issue here is not self-preservation but solidarity. Let's be blunt:
Every infection delayed saves the lives of others.
This is so because those who get very sick
cannot survive without the medical attention provided by limited number of health workers
and a limited number of hospital beds.
If a virulent disease is allowed to run its course unchecked,
everyone gets sick at the same time and the health system is overwhelmed.
This results in needless deaths.
Preventive confinment will not necessarily reduce the total number of
infected people but it may slow down the spread of the disease just
enough to prevent needless deaths by limiting the maximum number
of serely ill people at any given time so that the health care system can handle them.
The second wave :
Governments are prompted into confinement policies once the death toll rises.
Public support is not difficult to garner at first.
However, the social and economic costs of such measures are such
that deconfinment can be expected to be decreed typically too early.
A virus which was potent enough to cause a pandemic from a single case
is potent enough to restart it as soon as confiment measures are no longer strict enough.
So, the epidemic can be expected to rise again,
until one of the following conditions is met:
A very large percentage of the population has been contaminated.
A vaccine has been made available and administered massively.
A miracle cure is promptly found (highly unlikely).
Ruling out this last possibility, a vaccine has never been developped in
less than one or two years. Any lesser timeframe is (overly) optimistic.
(2022-09-09) Early forms of vaccination by nasal insufflation.
(2019-02-08) Caffeine = Theine = Guaranine = Mateine
The most widely consumed psychotropic substance.
Unlike most other psychoactive substances, caffeine
is legal and unregulated nearly everywhere.
However, it's not recommended for children under 12 and it's
strongly discouraged for women who are either pregnant or breastfeeding.
A typical cup of coffee contains about 100 mg of caffeine.
Caffeine was first identified in 1819 by
Friedlieb Runge (1794-1857)
who was honored by the following Google Doodle on his 225-th Birthday:
(2022-08-29) Eugenol
(clove oil).
Nature's miracle dentistry drug.
Suggested by Thomas Vong, dentist in Paris, France (7, rue de Langeac).
Cloves (French clous de girofle) is
the main source of a traditional remedy now identified as eugenol, ubiquitous in modern dentistry.
This chemical is also present in other spices, including:
allspice (Jamaica pepper, French quatre-épices),
nutmeg (French noix de muscade),
cinnamon (French cannelle),
basil (French basilic) and
bay leaf (French feuille de laurier).
This allylbenzene was first obtained in 1834 by
Carl Jacob Ettling (1806-1856)
a former assistant of Justus von Liebig.
The name eugenol was coined in 1858 by
Auguste Cahours
(1813-1891; X1833)
after Eugenia caryophyllata, the former
(Linnean) name for
cloves (now best called Syzygium aromaticum).
(2023-05-17) Viruses (Ivanovsky, 1892)
Pathogens smaller than bacteria.
In 1892,
Dmitri Ivanovsky (1864-1920),
passed the sap of tobacco plants infected with s mosaic deasese through a
Chamberland filter,
designed in 1888 by a collaborator of
Louis Pasteur,
Charles Chamberland (1851-1908).
Such a filter will not yet any bacteria through but Ivanovky found that the filtered sap
remained infectious, even at low concentrations.